September 1, 2015
Crude oil surged 27.5% over three days: what is driving this move?
Commentary by Robert Balan, Chief Market Strategist
"Venezuela has been contacting other members of the Organization of the Petroleum Exporting Countries (OPEC), pushing for an emergency meeting with Russia to come up with a plan to stop the global oil price rout."
Wall Street Journal, August 28, 2015
"We're probably under-pricing crude as it is," Larry said. "We're seeing a lot of demand here, economic growth has been strong. We're seeing lots of numbers showing signs of positive reaction. The strong US economic figures also added momentum to a global stock market rally that lifted bourses that have lost trillions of dollars in value in a rout over the last week or so."
Carl Larry (Frost & Sullivan), August 28, 2015
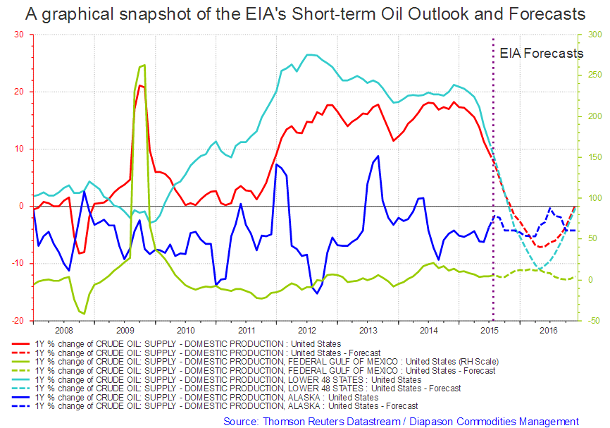
Crude oil prices surged 27.5% (Brent 25.5%) over Thursday, Friday and Monday – the biggest three-day gain in 6 years. What triggered these sharp gains? What do crude oil traders know that almost all of oil analysts seem to have missed? There could be several possible reasons for the sharp move, which may have acted in concert, as follows: (1) OPEC potentially will have an emergency meeting, (2) there could be early signs that the crude oil supply glut will become smaller – the EIA (Energy Information Administration) will revise US production history and forecasts lower (3) global demand is about to increase. The news flow suggest the convergence of these three factors. We look at these issues one by one.
A possible emergency OPEC Meeting - Venezuela has been lobbying other members of the OPEC, pushing for an emergency meeting to find ways how to counter the ongoing oil price debacle. Another OPEC member, Algeria, actually wrote to OPEC recently stating their concerns over the oil price slump (Algeria and Ecuador have also been devastated by the oil price collapse). OPEC had not planned for a meeting until December 4th, but there has been a lot of pain generated by the declining oil prices, and so there is potential for an emergency meeting which may redress the falling oil price issue. But latest stream of statements from Saudi Arabia does not indicate that the crude oil world marginal producer is about to veer off this path that they put in place last year. We do not believe that there will be an OPEC emergency meeting to discuss the possibility of cutting production rates in OPEC. But Saudi Arabia may also be extending what could be an olive branch saying that it is willing to talk with other oil producers about curtailing production, and about its need for a level playing field (OPEC Bulletin, September 2015). A decision about curtailing production, if any, will come in December.
Supply maybe about to adjust significantly – reports came in showing that the EIA changed the way it calculates how much oil comes out of the ground, using a survey of producers in key states instead of relying on data from state agencies and computer models. As a result, 13.2 million barrels of oil production vanished with a government blog post. Looks like someone may have gotten hold of that news ahead of the market.
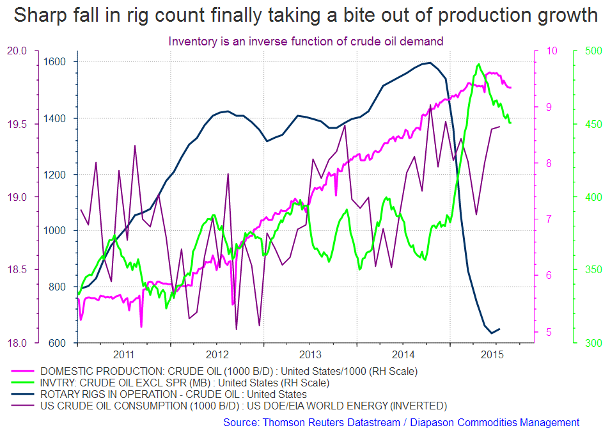
Oil prices are falling primarily due to perceived crude oil supply glut where US shale producers have been the reason for the oversupply. Recently there has been a trend of falling US production which we believe will persist for some time. The oil rig count as reported by Baker Hughes stands at 625 in the United States as of this week. Last year at this time, the rig count was at 1,588, so the number of rigs has dropped by 963 rigs. The lower number of rigs means that eventually U.S. production, which is now falling, will continue to fall further. Falling production will take some pressure off the excess supply available in the global oil market. This fundamental factor is likely contributing to the large gains last week.
EIA released its forward looking Drilling Productivity Report for September 2015. For the fifth consecutive month the EIA is projecting significant future declines in U.S. shale production. For the end of September, EIA projects a decline of 93,000 barrels per day from the production level at the end of August. The previous projected declines had been 57,000 barrels (May), 86,000 barrels (June), 91,000 (July), and 91,000 (August); please see chart below.
The output decline is now running at around 90,000 barrels per month which if continues would see production down by more than a million barrels per day a year from now. On the other hand, oil demand in the United States has risen by a very surprisingly strong 828,000 barrels per day on average in 2015. Putting it in stark terms: crude oil demand that was stagnant early in the year has turned into an increase of more than 800,000 barrels per day now, and supply that was growing by more than 1.5 million barrels per day early in the year is now falling at a rate of 90,000 barrels per month. Why was the fall in output slower than many analysts expected? The answer lies in the highly significant increase in productivity per rig. EIA data shows that operating a rig for a month in the Bakken has an output of 692 barrels of oil today compared to an increase of 388 barrels/day two years ago.
Demand trend is on the increase – the revaluation of the Q2 2015 growth to 3.7% from 2.3%, which exceeded all projections, was ostensibly one of the reasons for the sharp gains in crude oil on market speculation that US growth will counterbalance a weakening of demand from slowing China growth. The International Energy Agency (IEA) also reported that global consumption is set to grow by 1.4 million barrels a day, even as supplies outside OPEC are expected to contract in 2016 for the first time since 2008, sliding by 200,000 barrels a day. The IEA data also underpinned oil prices late last week.
Moreover, crude oil demand continues to look strong, even in embattled China. July’s data showed China’s crude oil demand up 6% YoY (595,000 b/d). China’s gasoline demand was up 19.9% (411,000 b/d) while diesel demand was up 3.5% (121,000 b/d). This strong demand trend is further supported by continuing strength in global refinery margins. The case in point: US crack spreads are still trending higher. Since these spreads are fed by crude oil directly, positive simple margins are generally constructive for oil demand (see Commodities and Economic Highlights story below).
There are other potential sources of global demand. In early August, the Chinese government approved a one trillion yuan, or $161 billion, bond to build infrastructure. While the stated motivation for this bond issue is to provide stimulus for the Chinese economy, infrastructure projects require energy. This should translate to more oil demand from China in coming months as the projects are implemented.
Therefore, sharply declining U.S. production and the potential for increased demand from China are positive signals for the price of crude oil. Given the current depressed price level of crude, any news of falling supplies from any area of the world or increasing demand will support prices.
 |
Main drivers this week:
|
Commodities and Economic Highlights
Commentary by Robert Balan, Chief Market Strategist
Refining Spreads support the view of a recovery in oil prices
Crack spreads are not signalling much lower prices for crude oil, and in fact provide leads to an imminent recovery. These distillate spreads are likely to provide price leadership, and will gain additional strength, on any new dips in the nearby active month of crude oil futures. We maintain a sharp focus on crack spreads as they will signal the intensity of demand for products, which would ultimately translate into demand for raw crude oil.
Gasoline Spread: Energy consumers do not buy raw crude oil – they buy oil distillate products. Therefore, refining crack spreads are excellent tools by which to gauge the current level of demand for the energy complex. Lower crude oil prices have pushed the prices of gasoline, heating oil, diesel fuel, jet fuel and other oil products lower as well. Classic economics theory suggests that lower prices will eventually stimulate demand. That is the reason why distillate products prices have outperformed raw crude oil prices since January this year.
These are the implications: (1) Gasoline crack spreads did signal that crude oil was going to find a trough back in January; (2) while the price of crude oil continued to fall, gasoline crack spreads started a rally that took them from $8.16 per barrel on January 1 to $24.2 last week. The current lows in oil came shortly after the consolidation low in the spread on August 7, so this spread may be signalling a turn-around in price as well; (3) as the weekly chart of the active month gasoline crack spread indicates, this refining spread is still rising sharply at this time (see chart below); (4) last year at this time, this processing spread was at the $8 per barrel level, indicating that gasoline is currently outperforming crude oil due to strong demand for gasoline.
Heating Oil Spread: The heating oil crack spread closed at $20.96 per barrel last week – a level which is not far from where it was last year at this time. The weekly chart of the heating oil crack spread also displays the seasonal weakness during the current period. We expect that this will soon be followed by a further widening in this processing spread as refineries begin to produce more heating oil for the coming late fall and winter months.
Large changes in the heating crack spread had previously led the big changes in the crude oil price. So we were expecting that a similar situation will also happen this time around – the recent sharp uptake in the heating oilcracks may again be signalling that big upside moves were due for the Brent Crude Oil spot price. And that point of view has been validated by the large gains in crude oil prices on Thursday and Friday.
By and large, the fundamentals for crude oil are starting to turn around, a situation confirmed by the large gains in oil prices last week. We expect that the key elements for a crude oil recovery in the medium-term will be a sharper fall in US production and a weaker US Dollar which we expect to see extending into the medium-term. The crack spreads will continue to provide a window into the real demand for crude oil, so we will continue to maintain focus on these variables.
China is on a commodities stealth-buying mode – watch their SPR purchases!
A Reuters report mentioned that the plunge in commodity prices over concerns on the outlook for Chinese demand for raw materials may be misplaced in aggregate. The report mentioned that " . . . (those) are fears not necessarily in evidence, as can be seen by trawling through the detailed customs data for July. There were at least 21 commodities that showed increases in imports greater than 20 percent in July this year, compared to the same month in 2014."
Reuters concluded: "There is always a danger in placing too much emphasis on just one month's figures, but the above numbers show that commodity import demand in China is far from weak, especially when looking at raw materials beyond the majors."
While many of those commodities imported in significant quantities in July by China were indeed "minor commodities", there were some major ones showing strong growth as well. For instance, crude oil imports jumped 29.3% in July from the same month a year earlier. Other examples are ethanol imports: there was a massive increase of 236,594% in ethanol imports in July, with the month accounting for more than half of total imports of the fuel so far this year.
It was highlighted that imports in agriculture products and in base metals that showed "surprising" strength: " . . . wheat (was) up 158%, barley by 67.9%, corn by 1,184%, cassava by 28.5%, rice by 78.2%, soy oil by 25.8%, palm oil by 53.3%, natural rubber by 70.1% and sugar by 72.7%. . . Among the metals, tin ore and concentrates imports increased by 27% in July, refined tin by 50.7%, zinc ores by 84.5%, molybdenum by 139.8%, tungsten by 33.4%, uranium by 227%, chromium ore by 35.8%, silver by 63.3% and platinum by 37.9%."
Our impression is that the supposed slowing of Chinese demand for commodities (which is arguably untrue) was not the primary catalyst behind the decline in prices of natural resources in July. Attributing the severe July decline to China is not backed up by data – that conclusion is incorrect. We attribute the mistake in equating the growth fundamentals in China with current demand for natural resource materials because there is real demand which was primed by the favourable level of commodity prices, which have become very cheap relative to production costs.
In hindsight, the sharp commodity price decline in July was likely triggered by Fed's chatter about raising policy rates in September, which pushed up the US Dollar, which in turn soured sentiment further on commodities. The end result was a devastating fall in commodity prices in July.
We also see some interesting twists on the CNY devaluation vis-a-vis commodity prices. We also attribute the accelerated demand in crude oil for the Chinese Strategic Petroleum Reserve (SPR) to what we believe is an advance knowledge of the impending CNY devaluation this month. With that as prime mover, we have seen a significant volume of crude oil purchases over the last three months to the point where China was grabbing any available floating storage available. An understanding of the CNY devaluation's dynamics is crucial for expectations of the same mechanism in the future. We believe that the CNY is still overvalued by 10 to12 percent relative to EM peers, so it is fair to assume that SPR purchases would front-run any further CNY devaluation in coming months.
So it is ironic that the CNY devaluation, which many economists suggest would depress commodity prices, had actually provided a lift to embattled natural resource materials. So any further plans to devalue the CNY should benefit commodity prices in the short-term at least. The CNY devaluation should also be favourable to commodities in the longer term schematics. A more competitive CNY level should enable China to claw back export share, and that would redound to more consumption of raw materials which would support prices.
Charts of the week: EIA short-term oil outlook and forecast; Rig count and US oil production and consumption
|
|
|
|