November 16, 2015
China deep into a rebalancing process and GDP could see the start of recovery next year
Commentary by Robert Balan, Chief Market Strategist
"To achieve the goal of doubling the size of economy and per capita income by 2020, it needs to maintain 6.5% growth rate for next five years, economists believe. The current target rate below 7% signals that Beijing is keen to turn around the economy and is patient for longer growth."
Renea Harron, November 3 2016
The activity and economic data coming out of China are mixed. Industrial production has slowed down and had missed expectations. Fixed asset investment had slowed as well, following the recent surprise Yuan devaluation, but remained in line with expectations. On the other hand, retail sales beat analysts’ expectations. The general picture is a slow down in industrial activity, in exports and imports, as well as in infrastructure spending. Dispelling the gloom is an upbeat household sector, and a recovering property sector. China is indeed deep in a rebalancing process.
The details, when juxtaposed, are indeed bewildering. Bullish (positive) data and signs of success in the rebalancing process include Alibaba's Singles Day sale of USD 14.3 billion, which surpassed last year's sales of USD 9.3 billion – 60% higher than last year’s sales. The scope of this one-day buying spree is staggering – it dwarfed previous best sales levels for the U.S.'s Black Friday and Cyber Monday combined. Statistics like these bring home the fact that China is likely having success in converting its economy to a consumer model. It is in fact becoming the world's largest retail consumer. The Chinese spending middle class may become even more formidable – it is still growing, and growing fast by U.S. and other developed countries’ standards. Bearish (negative) data will inevitably be focused on GDP growth, which is still sliding, and on industrial production which remains depressed.
The consequences of the big Chinese economic reboot under President Xi Jinping are causing so much pain elsewhere in the world especially in the commodity-producing countries in the Emerging Markets. The Chinese government wants to transform China's key economic force from export-led manufacturing economy to a consumer and services led one. Manufacturing activity will be transformed from focus on low-value retail goods to high-value industrial and electronic goods. It is the same kind of restructuring that led post-war Japan to become an economic powerhouse, after the quality of its export products rapidly moved from laughing stock to high demand quality products. China is also taking more steps to make the economic rebalancing proceed smoothly.
Regional growth which is led by local governments will not be allowed anymore to go unfettered, although decisive monetary and regulatory steps have already been taken to nurse the domestic property sector back to health. Revenues from local housing markets are a key source of regional governments operating budgets. The property sector is more than a milking cow for the regional government however. Like everywhere else, housing is THE business cycle, although its impact kicks in only after a long lag. Wealth effects and second-round economic benefits from house building activity are important generators of national GDP growth. The recovery of the property sector was kick-started by decisive monetary, fiscal and interest rate interventions that are starting to produce desired results. We discuss the impact of these policy changes below.
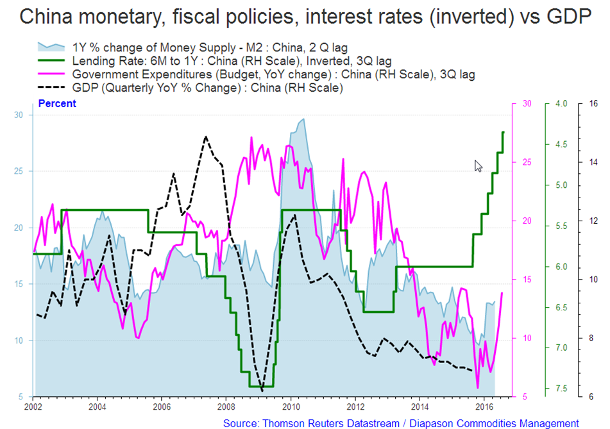
China's potent combination of monetary, fiscal and rate policies could start to show positive results soon
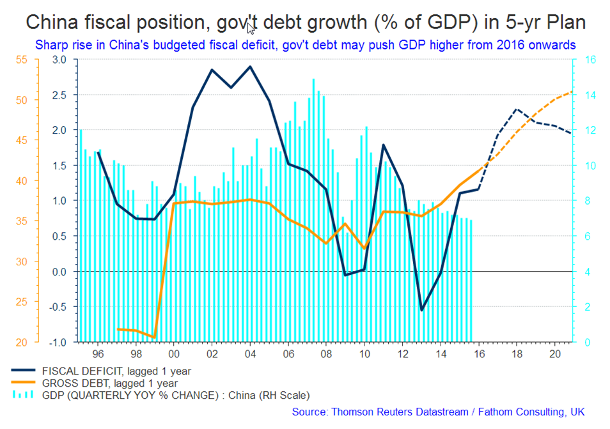
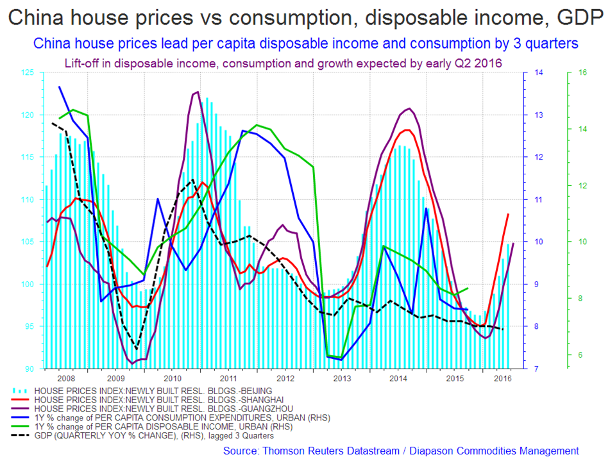
Firstly, the combination of sharply falling short-term interest rates, an expansionary national fiscal budget, and rising domestic M2 money supply could eventually put a floor on the currently sliding Chinese GDP growth. Domestic GDP growth lags behind this potent combination of monetary, fiscal and rate policies by about 2 quarters, so it may be the case that we could start seeing stability soon, and perhaps even tentatively stronger Chinese GDP growth by mid-2016 (see the first chart of the week below). Secondly, China's property sector is also responding to the powerful combination of monetary and fiscal policies, and a regiment of sharply weaker interest rates. Lower interest rates, rising money supply, and an expansionary fiscal budget are reviving new residential and commercial house sales. Thirdly, the administration of Mr. Xi Jinping may be discovering the lessons from other major countries' efforts to reflate that monetary policy can only go so far. In the 13th 5-year plan still being threshed out, Fathom Consulting projected the likely trajectories of future Chinese national government fiscal deficit and gross debt over the next five years. The scope of future deficit and debt would be the most significant since the Great Financial Recession of 2008, up to 4 or 5 times the layouts from 2008 and 2009. This future expansionary policy may be enough to achieve a lift-off and provide wherewithal for a recovery in Chinese GDP growth, perhaps well into 2020 (please see the second chart of the week below). Finally, the apparent recovery in Chinese property sales also has a lead, contributory impact on GDP growth, providing wherewithal for a future rise in the disposable income and the consumption components of domestic GDP — the growth of these components typically lag behind the recovery of the property market by about 3 quarters. A significant improvement of these GDP components is vital to the desired transition of China's economy to consumerism (please see the third chart of the week below).
We believe that market worries about a Chinese growth implosion are overblown; and most macro and financial data in the past months tend to crystallize our view. The rebalancing process is proceeding well, and the government has taken steps, many we describe as decisive, in promoting growth or at least in preventing further growth deterioration. Those steps take time to take effect, but by our reckoning the middle of next year is when the potent combination of monetary, fiscal and rate policies should show positive results. We believe that the global and emerging market economies will also improve by then, along with cyclical assets such as commodities and crude oil.
 |
Main drivers this week:
|
Commodities and Economic Highlights
Commentary by Robert Balan, Chief Market Strategist
The fundamental glut in sugar could be ending, as the four-year bear market ends
The price of world sugar traded at 36.08 cents per pound in February 2008, marking the peak of the previous up-trend cycle for sugar. In contrast, sugar traded at 4.43 cents per pound in 1999 and at 8.35 cents in 2007. After hitting a secondary peak at 31.96 in August 2011, sugar went into a sharp decline. The downtrend may have made a trough at 10.13 in late August this year. The upside reversal since then has reached as high as 15.54. We expect sugar prices to go higher further, essentially marking the end of the down-trend market.
Until August this year, sugar had several negative factors that prevented prices from recovering. Primarily, there was a global glut of sugar after back-to-back years of bumper crops in Brazil, India, Thailand, and almost everywhere else in the world. Bumper crops swell inventories. On top of that, there was a general decline in the price of commodities as a whole. Brazil, the world's largest producer and exporter, typifies the problems that sugar faced until a few months back. Brazil consumes a very large part of their annual sugar output for the production of ethanol, which is used generally as additive to gasoline for automobiles, or as a fuel itself. But that being the case, sugar is susceptible to the volume of gasoline being sold. It is also impacted by the low oil price, ethanol being produced generally a competitor for gasoline when ethanol is used as a direct fuel. With the sharp decline of crude oil prices since June 2014, demand for sugar-based biofuel in Brazil fell as well, adding further pressure on the sugar price. Moreover, the US Dollar rallied further, which negatively impacted sugar from its inverse correlation with the price that is denominated in US Dollars. There is a historical inverse relationship between the Dollar's exchange rate and sugar, and commodity prices in general.
Looking back in hindsight, in the past three years, long positions in sugar futures traded on the Intercontinental Exchange were money losers. This changed on August 24, after the front month October sugar futures fell to 10.13, the lowest level since June 2008. That level turned out to be the lows, and sugar began what would become a new bull trend. What is the reason for this? It may be that the fundamental glut in sugar could be ending. In early September, the International Sugar Organization announced that there may be a shift to a "statistical deficit" in the sugar market this year. Simply put, the rebound in sugar price came as the fundamental supply situation in sugar shifted from oversupply to expectations of a deficit. Further analysis will of course show this to be inevitable, as it always happen when a commodity price falls close to or even below the cost of production. The price of sugar has fallen to a level where growers, millers, and other transporters found that growing sugar has become uneconomic. That is a very strong incentive to stop growing the crop; therefore, production levels fell sharply.
The other significant mover of sugar prices, as with all agricultural commodities at this juncture, was the market's anticipation of the negative impact of the current El Nino weather phenomenon. During previous manifestations of El Nino, the sugar growing areas of Brazil became too wet, reducing the yield of the sugar crops. The 2015-2016 El Nino could be the most powerful since 1997, and may even become the most powerful on record. Brazil has already started seeing wet conditions, so the market has started to assume the worst case for the Brazil sugar crop. On the other side of the Pacific Ocean Southeast Asia has started to become dry and is coming close to drought conditions. That may also impact sugar crops in India, the Philippines, Indonesia, etc., for the opposite conditions in Brazil.
That rise in sugar prices to as much as 53% in three months had investors and hedge funds chasing the market price. It might as well be as the price of many agriculture products have started to come alive. Technically, the next price level which may provide resistance is at 20. That is another 60% in as short as four to five months. New investment money is causing open interest to rise from just under 744,000 contracts on October 12 to circa 840,000 contracts as of last week. The increase in long and short positions of almost 13% suggests to us that more investment money will be flowing into sugar over the rest of the year.
The impact of El Nino on world wheat production
According to the Climate Prediction Center (CPC), there is circa 95% chance that the El Nino weather phenomenon will continue strengthening through the Northern Hemisphere's winter of 2015-16, and then gradually weaken through the spring of 2016. By now, almost all meteorologist of good public standing agree that the events predicted above will likely come to pass. If this forecast does materialize, the global weather could have varying impact on wheat through spring next year.
Australia will be affected the most by El Nino and any consequent La Nina because of its geographical location. Australia will likely see a persistent decline in wheat production. In the past eight cases out of ten El Ninos, wheat harvest declined by an average of 36%. Translating this into actual crops, with a probability of 80%, the wheat crop in Australia will fall by 16.5 million tons in the case of El Nino extending into spring of next year. Australia, even before the current El Nino became manifest, has already been in the grip of drought – so El Nino will further worsen the drought level in the country. India's wheat crop, on the other hand, may only suffer mild consequences of El Nino. Over the past 25 years, wheat production in India suffered in only two cases. China's wheat production may not also come into very dire situation because of El Nino. A significant reduction in Chinese wheat production due to El Nino was recorded only in 1994-95. In the US case, El Nino is a slightly more significant negative for the wheat crop, but nothing out of the ordinary. A decline in the US wheat production was observed in only five cases out of ten during El Nino.
The aggregate world wheat production may not suffer much, but it may be enough to put wheat prices on notice. Of course, if the weather pattern deteriorates to a new record, global wheat production will suffer on its own, or in sympathy with other agriculture products which will likely rise sharply in price. It is that Australia should be monitored very closely for significant changes in wheat production going into the new year. This country's wheat crop is at most risk from El Nino. Climate variations usually bring drought to the continent, which negatively impacts the wheat crop. On aggregate however, barring an unexpected escalation of adverse weather conditions due to El Nino, the world may be able to make up for Australia’s expected wheat crop losses. But counting on averages when dealing with El Nino may not be the best strategy. The best stance is to plan the worst, but assume a more
At this time, the prices of wheat have stabilized very close to 500, and prices have been sideways since May last year, with intervening rallies every now and then. We expect the front month wheat to hold at circa 480 during the current down-moves testing the lows. Holding the double bottom support will be rewarding as well as we expect wheat to rally further to 650 during early 2016. The resistance level at 650 is not considered a "hard" number but it is significant because taking out those levels away may trigger a full scale up-trend to the area of 675.
Charts of the week: China monetary, fiscal, interest rates vs GDP; China fiscal, gov. debt growth in 5-year plan; China house prices vs. consumption, disposable income and GDP
|
|
|
|
|
|