February 29, 2016
Lessons from history? Today’s oil market follows similar steps to that of 1997-1999
Commentary by Sammer Khatlan, Oil Analyst
"Bottoms in the investment world don't end with four-year lows; they end with 10- or 15-year lows.” Jim Rogers
During times of heightened uncertainty and volatility, traders and analysts will look for anchors on which to build forward-looking theses. Looking back to past market phases can give a better sense of future price movements by identifying trends, patterns and inflection points – this is a much-employed exercise. However, rarely is it the case where the past and present backdrops are so similarly aligned: for scholars of oil economic history, parallels will have been made between today’s market and that of 1997-1999.
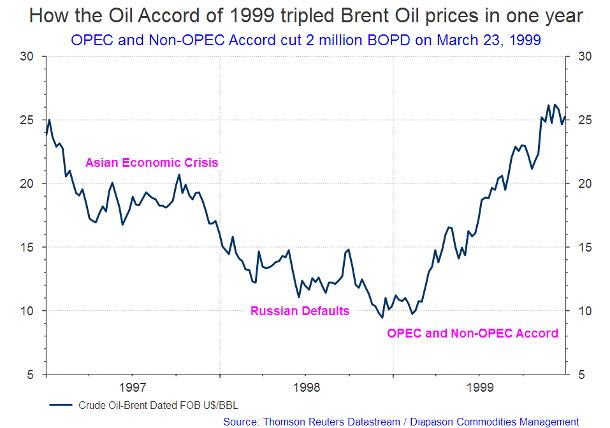
This period was one of last major oil downturns as prices declined by more than 55% to under $10/bbl. Much like today, the consensus view was overwhelmingly negative, with many predicting that prices could fall even further. By March 1999, OPEC cut production along with Mexico, Norway, Russia and Oman, who all reduced output. With Asian and US demand stronger than expected, oil prices reversed and trebled within a year. We are not suggesting that this will happen today but we do feel that like then, the market is coming to an inflection point. There are nuances between the markets of now and then but the striking similarities are worth comparing:
Then: negative sentiment. “Algeria's energy minister declared, with only slight exaggeration that prices might conceivably tumble “to $2 or $3 a barrel.”” (The Economist, Mar 4th 1999). Now: Goldman Sachs says it would be no surprise if oil prices drop below $20/bbl adding that the current surplus is “more extreme than the industry downturn of 1998 to 1999”.
Then: Demand worries over economic troubles in Asia. The crisis of 1997-1998 resulted in sharp reductions in currency valuations which had strong negative spillover effects on oil prices. As industrial production across the region slowed, so did demand for oil. Now: Worries of a Chinese hard landing have prompted fears of another Asian crisis. The possibility of slowing Chinese demand owing to its economic transition and potential attempts to depreciate the Renminbi have dragged down other Asian and wider EM currencies.
Then: bearish IEA reporting huge crude oversupply and ‘missing barrels’. In April 1998, the IEA purported that the discrepancy between supply and demand, and lack of stock build in the industrialised world’s crude supply, resulted in “missing barrels” of 170 million. By April 1999, after significant revisions, the unaccounted for crude needed to confirm the massive oversupply between 1997 and 1998 had ballooned to 647mmb. Now: by 4Q2015, the IEA estimated a market surplus of 2.2mmbd. The agency’s supply and demand approximations imply that supply cumulatively reached a surplus of 840mmb by 4Q2015. Whilst increases in US and Europe stockpiles could be accounted for, some 600mmb of excess had vanished from the international markets.
Then: Fear that a major OPEC producer will increase output. Iraq had been under UN constraints to its oil sales. Under sanctions, production had been capped below 1.5mmbd yet markets were worried that capacity could be increased significantly, adding to the already gloomy global supply situation. Now: As a result of Western sanctions to its nuclear activities, Iran’s output and exports were heavily constrained. The nuclear deal struck early this year removed these shackles, prompting fears of an Iranian tsunami of oil to an already oversupplied market.
Then: OPEC in disarray. There were several failed attempts at agreeing upon production cuts and members’ cheating on quotas was prevalent. “The cartel is already moribund…unless Saudi Arabia can bring it back from the dead, which is highly unlikely” (The Economist, Mar 4th 1999). Now: in its latest meeting, OPEC left its existing output policy unchanged and was unable to agree a figure for the collective quota. The meeting overran by several hours, prompting analysts to lament the extreme divisions of the Group and lack of cohesion, with some claiming that ‘the cartel is basically broken’.
Then: Technology reducing cost of supply. “Rapid technological advances have pushed the cost of finding, developing and producing crude oil outside the Middle East down from over $25 a barrel (in today's prices) in the 1980s to around $10 now.” (The Economist, Mar 4th 1999). Now: in the low price environment, a new wave of innovation in exploration emerged. North American companies focused on efficiency, optimising cost per barrel through refracking. With service cost reductions, advancements in data and monitoring software and increased efficiencies, breakevens for top producers in the region have fallen nearly $30 from ~$80.
Then: warm winter owing to El Niño curbing demand for refined products. The warmer-than-normal winter weather in all of the northern hemisphere kept distillate and fuel oil prices under downward pressure in all major product markets. (IEA Oil Market Report, March 1998). Now: the current El Niño has equalled the record measurements of the late 90s. In January, middle distillate stockpiles in the US and northern Europe stood 47mmb above average and 59mmb above last year.
Then: Political Change 1 – Venezuela. December 1998 saw the seismic shift in Venezuelan politics as Hugo Chavez won the presidential elections, championing his version of socialism against the then unpopular traditional political elite. He pushed an oil u-turn, ending a decade of increasing production and slowly driving out foreign oil investors. Now: after 16 years, the opposition party won a supermajority in the unicameral national assembly in its first elections versus the Chavista. During the Chavez era, oil production fell 10% and its infrastructure has heavily degraded and depleted due to zero investment and maintenance.
Then: Political Change 2 – Saudi Arabia. King Abdullah takes power from his ailing brother, King Fahd. By 1998, low oil prices had crippled Saudi’s economy: output had fallen ~2%; both the current account and budget deficits had climbed to ~10% of GDP; and debt had risen to nearly 100% of GDP. Now: King Salman took the crown following King Abdullah’s death in 2015. Its budget deficit stands at $98bn, 15% of its GDP. Riyadh has withdrawn $70bn in funds managed overseas and has lost $73bn since oil prices slumped. The IMF contends the state will be bankrupt within 5 years unless oil prices reverse.
The comparison between now and then gives some perspective to such a market that remains difficult to assess. Like then, the market consensus (from a positioning and analyst outlook standpoint) has been strongly bearish for some time now, particularly when assessing the front-end of the price curve. This is a precariously concentrated viewpoint and is not sustainable.
Saudi agreeing to a production freeze with other producers indicates that there is more happening in the background between OPEC and non-OPEC. The Gulf-OPEC ‘market share’ strategy is showing results as the US shale industry struggles against waves of financial defaults. The market is gradually coming round to the reality of severe corporate financial distress, immense global capex cuts and significant upstream project write-offs – all of which means a huge impending supply gap. We feel the market is finely poised and something will need to give as we approach this new inflection point. If US output continues to progressively decline and global inventories begin to draw down, conditions for OPEC to cut will be ripe – the Group may yet again have its day on oil prices as it did in the late ‘90s. Unlike then, CTAs play a far more influential role in today’s market – in the same way that these programmes pushed future prices beyond their fair-value on the down move, the same could happen when the market reverses.
 |
Main drivers this week:
|
Commodities and Economic Highlights
Commentary by Robert Balan, Chief Market Strategist
Agriculture sector: in forefront as El Niño transitions into La Niña
The possible, even likely, transition from a record breaking El Niño to a La Niña event could be a significant variable affecting agriculture prices over the next 12 months. Anticipating and understanding the implications of this meteorological cycle change can give investors who are seeking an edge in established assets that offer significant risk/reward scenarios.
El Niño refers to abnormal conditions along the equator in the central and eastern Pacific Ocean when the sea's surface gets warmer than usual. In an El Niño event, the water temperature in that area typically increases 1-3°C (about 2-5°F) warmer than normal. This seems inconsequential, but in reality its effects add huge amounts of heat and moisture to the atmosphere, ultimately affecting the air pressure and rainfall patterns across the Pacific and beyond.
La Niña is the meteorological counterpart to El Niño, and refers to the event when sea-surface temperatures in the equatorial central and eastern Pacific turn cooler than normal. The lower surface temperatures hinders transfer of heat and moisture to the atmosphere, again affecting air pressure and precipitation patterns across a large region as El Niño does -- but this time in the opposite direction.
That area of the Pacific is still grappling with one of the strongest El Niño cycles since 1950 when NOAA started keeping official records. The prevailing El Niño currently measures 2.30 degrees Celsius above average, which is well above the 2.0 degrees level which defines a "very strong" cycle. Meteorologists warn that it is possible temperatures may rise even further – meaning the El Niño effect will get worse as it peaks – which would put the current El Niño in a class by itself. NOAA says that El Niño will gradually make a peak through the coming spring, and then conditions normalise for a period. Then, if the usual pattern repeats as in previous cycles, conditions will change to a La Niña over the summer months. Five of the 6 previous "strong" or "very strong" El Niño's since 1959 have transitioned into "very weak" La Niña. The reversal of the cycle could be rapid at times.
What are the effects of La Niña that differentiates it from El Niño in the US? La Niña periods frequently, but not always, result in drought conditions in Southern California and below normal rainfall in the US central plains. During La Niña periods the US Northwest tends to be wetter than average and the Caribbean and United States had tended to have more incidences of strong hurricanes. More importantly for agriculture prices, La Niña generally leads to warmer and drier than normal summer in the US Midwest and Plains states. These are among the most important regions for growing grains and other grain seeds in the US. A La Niña event typically reduces the amount of harvestable corn, wheat and soybeans, the primary crops planted in those areas. It is worth noting that in 1997 - 1998, when grain and grain seed prices fell the most due to La Niña, it was preceded by the case of strongest El Niño on record until the current El Niño surpassed it. Although it is not a given that a transition from the current El Niño to la Niña will cause similar price dislocations, or is it a given that El Niño will transition into a La Niña this time around. However, it is on record that La Niña effects could even be more devastating to US grain crops than El Niño, which wreaks its devastation mostly in the Pacific and African regions.
The data is very compelling, however that corn, wheat or soybeans could be profitable for investors willing to take more than average risks, when or if, the current El Niño transitions into La Niña. Another advantage lies in the fact that grain prices, e.g., corn, wheat, and soybeans prices are below 1-, 3- and 5-year ago levels. While low price is not necessarily the only measurement for cheapness, the low prices do provide additional comfort to those looking to take advantage of a potential transition to a La Niña cycle. Those low prices could leverage into large percentage increases if the La Niña effect does happen this time around. There are no certainties in the events described here, but a transition does offer a good record of what happens to certain grain prices when it happens.
Will infrastructure spending in North America boost base metals?
The American Society of Civil Engineers (ASCE) recently graded the infrastructure in the US, and it was dismal – the overall grade is D+, only slightly above poor. This issue is taking more relevance as all the US presidential hopefuls talk about the crumbling infrastructure in the US. In the US elections this year, building infrastructure is a vital part of their campaign speeches, something that was unheard of during the 2012 election. The ASCE estimates about $3.6 trillion is needed by 2020. Even half that number at $1.8 trillion Dollars spent on infrastructure in the next four years is indeed a heady prospect. Take the simple case of Airports in the US. Fixing 40 large airports alone will give an enormous boost to infrastructure spending and to commodity prices as these airports require millions of tons of metal and concrete.
And it is not just in the US that talks of infrastructure building are raging. In Canada, the new Prime Minister Justin Trudeau won on a platform which includes deficit spending on infrastructure. The latest news say that Mr. Trudeau's party, the Liberals, have pledged to run deficits in the coming years in order to spend $17.4 billion over its first mandate on infrastructure projects — which they predict will create jobs and generate economic growth. Many economists agree that dose of stimulus is an entirely appropriate response to current economic realities in the country, especially in the case of the US and Canada.
So will a shift to infrastructure spending in North America provide commodities a boost over the next five years? This possibility is a crucial lifeline for resource producers in the two countries. The usual sources of commodity demand cannot be depended upon over the near-term. China's growth had slowed down, and remains moribund, waiting for previous stimulus measures to take effect. China has far more infrastructure than they need at the moment and it will take a while for them to fully implement the urbanization program they have planned for the entire country. But the Chinese government said they are committed to the program, and just assured the G-20 ministers that growth will take precedence in the near-future to stabilize regional and global markets. But meanwhile, there are other exciting developments in North America.
The North American infrastructure market traditionally is a leading area of institutional investor activity. Demand for infrastructure development and re-development in both the US and Canada has grown significantly over the past decade. A number of North America-focused funds had come to the market and a number of infrastructure-specific allocations had been seen in recent years. But this new development, where governments are the leading proponents of building infrastructures, has more potential to transform the commodity price picture, if followed through.
These North American developments are not exactly a surprise to the market, and in fact had been instrumental in providing a recent floor to the prices of base metals. For instance, industrial metals Copper, Aluminium, Lead remain well above the 2009 levels, unlike crude oil prices which had gone below Great Financial Recession levels. The combination of the base metals' resilience, cement and building material producer equity outperformance, the size of the demand, and the state of US and Canadian infrastructure being election issues, clearly indicate that the world's latest infrastructure market which is North America is starting to reawaken. Aside from commodities, equity sectors like Cement, Building materials and construction equipment companies should do very well over the program years, and local US manufacturers will primarily benefit, both American and Canadian.
Chart of the week: How the Oil Accord of 1999 tripled Brent Oil prices in one year
|
|