April 4, 2016
Will negative interest rates push up the prices of gold and other hard assets?
Commentary by Robert Balan, Chief Market Strategist
"How do negative interest rates play out for gold? Positively we think. The imposition of negative rates is a sign of distress, which is gold-bullish. Furthermore, the uncertainty surrounding the long run impact of negative rates as outlined in the BIS report is also supportive of gold. The BIS report seems to say that negative rates have brought uncertainty, especially as regards their impact on financial intermediaries, but have not delivered hoped for gains for households and businesses. This is to gold's benefit.” James Steel, HSBC's chief precious-metals analyst
NIRP, the Negative Interest Rate Policy, has been implemented by a number of major central banks in Europe and in Japan in order to further encourage lending by making it costly for commercial banks to hold excess reserves at their central banks. Following the implementation of negative policy rates, nominal yields on some bonds of highly-rated European governments have also dropped below zero. That has already happened in Japan as well. And there are speculations that NIRP is coming to the US as well.
This phenomenon started in Europe, and there are other factors which have helped bring the financial world into an NIRP regime: very low inflation, further “flight to safety” toward fixed income assets in Europe’s core, and — perhaps the main proximate cause — the increased scarcity of highly-rated sovereign bonds eligible for the European Central Bank's asset purchase program. The proof that these were indeed contributory factors is that NIRP simultaneously appeared in several European countries – at a time when global financial markets are not in crisis. According to a World Bank report, negative interest rates have been an extremely rare phenomenon. Even at the height of the Great Depression in the 1930s, U.S. short-term rates were never negative, and during the global Great Financial Crisis of 2008 some US Treasury bill yields only very briefly fell below zero, but bounced right back above it again.
The financial world has very little experience with NIRP, so there is still this feeling out process for what happens after NIRP is imposed, but this much we know: (1) that negative rates may help boost exports by encouraging currency depreciation; (2) it may support lending and domestic demand by further easing credit conditions, although the history of the current NIRP regime is still too short to make this conclusion; (3) NIRP compresses further the already-slim Net Interest Margin that accrue to banks in their reserves and portfolios, and (4) it could encourage excessive risk-taking by investors seeking a higher rate of return. It is actually point No. 4 which interests us the most because NIRP has potential implications for Emerging Market countries if investors' search for yield support further capital inflows to those regions, a likely offset to the threat of further lift-off in US policy interest rates. And what is good for EM regions is also good for commodities and other real (hard) assets, including gold, other precious metals, and even real estate and housing.
Many economists and policy makers fear the consequences of NIRP, as the primary victims will be savers and those that rely on interest income. But the situation seems nuanced because if the NIRP is not too deep and does not stay, global finance might adjust to the policy, with only temporary effects on the system. But in a worst-case scenario, an easy-money policy can create an asset bubble by making it easier to bid up prices for things like homes, commodities or precious metals. It will not necessarily stimulate the economy and it could spur troubling inflation, bringing in a condition known as stagflation, last seen in the 1970s – stagnant economy, high inflation and rising interest rates. This means that the efforts of the central banks, which went for NIRP to stimulate economic activity, have backfired. To understand how this may come about, we look at what may happen to money velocity under NIRP conditions.
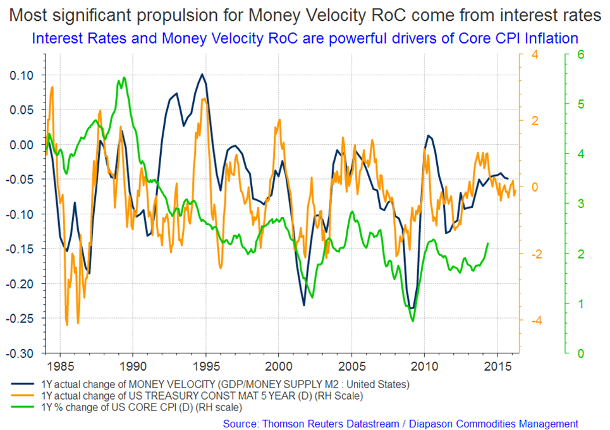
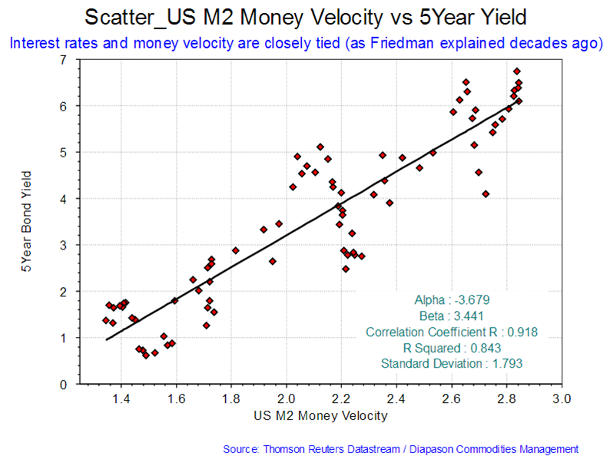
Money velocity has little to do with jobs or GDP growth (MV is a derivative of GDP; MV=GDP/M2 Supply) or with Debt (since Debt is the inverse of GDP, after a lag). The most significant motive force for changes in MV comes from interest rates (see the first chart of the week below). Interest rates and MV are closely tied (as Friedman explained decades ago). The correlation of the MV vs 5yr yield is a very high 0.918, and the r-squared of this relationship – assuming that functionally a linear fit is appropriate – is a heady 0.843 (almost 85% of MV changes can be explained by changes in the short-term interest rates); (see the second chart of the week below). The practical impact of this causal relationship: lower term interest rates imply fewer reasons not to hold cash.
However, there are certain complications brought about by NIRP. So, it may not be appropriate to project this theme linearly when there is a negative rate regime. The above idea is based on the relative difference between cash yielding zero and longer-term investments or consumption alternatives. This may not necessarily apply at NIRP regime. The reason that monetary velocity might behave differently at sub-zero rates is that people respond asymmetrically to losses and gains. That is, in most people, the pleasure of a gain is eclipsed by the pain of the same-sized loss. That "money illusion" – (investors’ aversion to nominal losses) becomes a wild card. This cognitive bias may cause savers/investors to behave strikingly different if they are charged for deposits than if they are merely paid zero on those deposits (even if zero is lower than other available rates). In that case, we might see a spike in money velocity once rates go through zero as cash balances become itchy for action, and hard assets become more attractive under this lens.
Demand for real assets in a negative nominal rate world should be significant as they would continue to deliver a nominal return (the zero bound can’t be passed on real assets). Investors with nominal liabilities (e.g., insurance companies) chase yield, real estate allocations would increase significantly and yields would compress even further. However, they would only compress up to the point at which they fall below the nominal liability requirements of investors, at which point allocations would decline. In the case of gold, rising inflation, or the bursting of the so-called “bond bubble” due to rising interest rates, could lead investors to view gold as portable wealth. NIRP is also potentially good for gold – when bonds are yielding negative 1%, gold looks much better in relative terms. If NIRP is limited to Europe and Japan and the policy does not stay too long, it could be that global finance will adjust to the idiosyncrasies of NIRP. But if the US is going NIRP as well, it might be that gold and other precious metals will embark upon a new up-trend phase.
 |
Main drivers this week:
|
Commodities and Economic Highlights
Commentary by Robert Balan, Chief Market Strategist and Sammer Khatlan, Oil Analyst
The US Dollar slide after the March FOMC meeting masks a complicated Fed reaction function
It has become harder for the financial markets to interpret the Federal Reserve's reaction function to economic data after the perceived volte-face during the March FOMC meeting. The subsequent US Dollar weakness after the meeting more likely reflects a dovish Fed communication instead of the US unit's response to significant improvement in the global macro sentiment, if not in actual global activity. In fact, concerns about the global economy were a key component of Fed Chair Yellen’s dovish message – a theme that has been echoed by central bankers in the Eurozone and in Japan, who are still looking for novel ways to kick-start their economies. All of this present issues to the analysis of the course of the US Dollar in the short-to-medium term, and requires a more nuanced view, since the US Dollar’s valuation is not an independent variable, but paired with the valuation of another currency.
The recent speech of Chair Janet Yellen reiterating a more dovish view still holds the US currency in thrall, and so we expect the US Dollar to continue its current downward course – but not for very long. Despite the current benign market view of the US tightening cycle post-march FOMC, US-G7 rate differentials have become favourable again for the US currency, suggesting limited scope for further USD weakness, in our view. Put into a temporal frame, the US Dollar weakness against the major currencies may last just for one month, or even less. FX fundamentals, which have previously weighed on the US currency (causing almost a year of sideways consolidation) have reversed, and should favour it over the next few months. We put our case for a stronger US Dollar in the near-term in the discussions that follow.
Case 1: Annual inflation rates (which have a direct impact on central banks inflation function) are again favouring the US currency, unlike in recent months. The US-EU GDP spread is also starting to turn in the favour of the USD.
Case 2: Against the Yen, both the GDP growth spread and the 2yr yield spread now favour USD against the Japanese currency, after a few months of the USD at a discount in the fundamentals.
Nonetheless, we acknowledge that after Ms. Yellen’s speech last week, there is now a higher bar for future rate hikes. And it will now take a longer series of positive US economic data surprises before the financial markets regain faith in the “strong-USD theme.” The March FOMC policy minutes (due for release this coming Wednesday) should show more clarity on the Fed’s recent thinking. However, the near-term trajectory of the US unit is also dependent on factors that impact its major G-7 competitors. We note that the Fed is not the only central bank with concerns about risk factors, internal and external. The proof is provided by the developed economies’ fixed income markets (especially in Europe and in Japan), which have remained strong year-to-date, pricing in rising concerns about lower potential growth and disinflationary pressures. Some of the Fed’s recent concerns about US domestic activity will likely be echoed by other major central banks in coming months regarding their own domestic activity (at a more urgent degree). For instance, the ECB is looking into widening the scope of their quantitative easing program. And the Bank of Japan is looking into the feasibility of going further negative in their policy rate regime. All these imply that any further USD weakness in the near-term is limited, in our view.
What this means to hard assets is clear. The initial enthusiastic surge in commodity prices and in the assets in EM space since February would be retraced and some of the gains would be given up. Nonetheless, we see that correction as a healthy development from a price discovery point of view. The interim should also enable developments in China to improve further, building on the initial set of positive surprises seen in late March. All these suggest to us that the time to pile into hard assets should be sometime in late Q2-early Q3, this year. Some positioning could be done in a few weeks, but the real time for hard assets in during H2 2016, in our view.
Oil bankruptcies in the billions – more pain to come for the industry
Despite signs of a nascent recovery in crude prices, the damage to oil and gas companies in the US has largely been done – and the tough times are far from over. In the latest report from the Dallas Fed, the economic situation in the energy-dependent Texas provides a microcosm of the sector itself: business bankruptcies rose 18.8% in the oil-heavy Houston-Baytown-Sugar Land area; oil and natural gas production tax collections for the first five months of fiscal 2016 were 48% lower than the same period in 2015; and the top 10% oil-producing counties in Texas saw a close to 1.4% increase in unemployment from 2014 to 2015 – this comes as the unemployment rate for the entire state fell 0.1% to 4.5%.
In 2015, 42 oil producing companies filed for bankruptcy. In December, 11% of E&P firms defaulted on debts coming due versus a mere 0.5% in the same period in 2014. When the obligations are due, firms will have the following choices: pay off in full, roll the debt over or issue expensive junk bonds. The first option is extremely unlikely, barring a cash-rich backer coming to the rescue or an ‘overnight’ recovery in oil prices. Rolling over debt is not straightforward, especially as lenders continue to scale back companies’ borrowing bases. Selling new bonds is also difficult as many companies’ holdings have far too little cash to pay off their existing debt. Often this will leave one option: bankruptcy filing.
So far this year, 9 North American oil and gas producers have begun Chapter 11 bankruptcy proceedings according to the law firm Haynes and Boone LP. Including 2015’s total, these bankruptcies (which include Chapters 7, 11 and 15 and Canadian cases) amount to $17.4bn in cumulative secured and unsecured debt.
Energy firms are the top issuers of junk bonds by a significant margin. The par value of high-yield energy company bonds on the market has increased by nearly $30bn in Jan and Feb 2016 – this represented new issues and downgrades and was by far the most than any other sector according to Fitch Ratings. The latest example is US producer Energy XXI, which, on March 5th, issued $1.45bn in bonds that pay a high 11%.
We believe that the number of E&Ps shutting down this year will be largely limited to the small-cap firms. Mid- to large-cap firms have greater facilities and resources to ‘buy’ more time which has been illustrated by the number of new equity offerings for funds: for example Carrizo raised $205m from the sale of 4.5million shares at two-thirds the price of its June 2015 stock value; Oasis raised $410m in equity; and Newfield sold $700m in bonds. However we believe this is only delaying the inevitable, effectively pumping financial lifeblood into dying/zombie companies.
The reality is that oil companies will see their liquidity deteriorating substantially going forward as lenders will reassess and reorganise financing models. Much of the shale business is based on low-quality borrowers so energy defaults will continue. Some companies are too far gone to save even if oil prices have hit a floor; the sheer amount of debt held by energy companies indicates that 2016 will be more severe than 2015.
For oil service companies, the situation is far more dire as these firms have considerably less bargaining power with lenders since they do not actually own the oil in the ground, they just help extract it. Already this year, 7 companies have collapsed owing a total of $2.5bn. Throughout 2015, the total value of bankruptcies equalled $5.3bn with 46 oil service bankruptcies (secured and unsecured) filed since the beginning of 2015.
We feel that many are missing the wider implications of a failing oil services industry, particularly given how integral they are to the production process. Some E&Ps may have expanded operations through vertical integration and acquired certain oilfield service businesses but it is equally likely that these kind of units would have been sold off to stay afloat/buy more time during the downturn. As such, with many oilfield service companies going under, the pool for E&Ps to find partners to help extract barrels and bring them to market is contracting rapidly – this means lots of crude will remain under ground as equipment is idled and workforce numbers deteriorate. Going forward, when/if prices do recover, the financing and business environment will be very different – many service companies will no longer exist and for those still active, their resources (equipment, labour force etc) will not be enough to stretch across the whole of the US oil sector. Also, it is too simplistic to assume that one can flick a switch and ramp operations back up quickly and seamlessly – according to IHS Energy, nearly 60% of the fracking equipment in the US has been idled during the downturn and it is estimated to take two - four months for some of that equipment to return.
Many US E&Ps and oilfield service companies emerged during the +$100/bbl days where cheap debt capital was available as long as it could be serviced. Many of these firms borrowed aggressively to spend, drill, build rigs, service equipment and add capacity but as stated before, the changing financial and economic landscape will not facilitate a great revival of fortunes even if oil prices miraculously recover. It has been reported that in 2015, the value of total proved reserves in the US E&P space declined by a huge $515bn. As the value of their reserves have fallen below the amount of money borrowed from their bank, this has left an impossible gap to close when redetermination occurs. Since many companies have already cut costs and reduced capex extensively, we believe there is very little room left to manoeuvre. Pain in the oil industry will continue; the very prevalent cashflow and credit crunch will hinder any recovery, resulting in more distress and pain for business owners and investors, both now and in the future.
Charts of the week: Most significant motive force for changes in MV comes from interest rates; almost 85% of MV changes can be explained by changes in the short-term interest rates
|
|
|
|