May 9, 2016
Gold net long positions are overstretched: gold price may correct as the US Dollar makes a short-term recovery
Commentary by Robert Balan, Chief Market Strategist
"The market could start to see that the economy in the U.S. might start to accelerate in the coming quarter. That should give us confidence that some of the dollar weakness will actually reverse. That’s the story investors should play for the second half of this year.” Dominic Schnider, head of commodities and Asia-Pacific FX, UBS Group Hong Kong
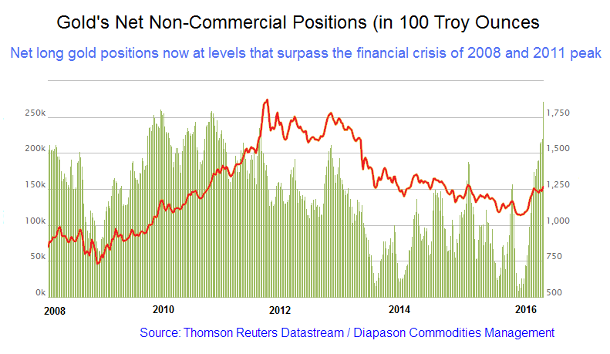
Positioning in gold has hit a critical mass – speculators are now net long gold at levels that surpass those seen during the Great Financial Crisis (GFC) of 2008/2009 and the 2011 major top in gold prices. Net non-commercial positions in gold soared from 220,857 to 271,648 within two weeks. We have not seen this level of activity since at least the GFC (see the first chart of the week below).
Gold hit a new 15-month high on May 2 at $1304 after a major breakout, but the momentum cooled off somewhat since then. Moreover, the recent gold price action has been disappointing – after the worse-than-expected nonfarm payroll data last week, gold took off, but was unable to follow-through to the upside. The reason was the resurgence of the US Dollar, which briefly fell after the payroll data, but came back strongly to finish the day at the high. The Dollar’s strong come-back suggests that the market environment may be starting to turn unfriendly to gold and the other precious metals. Not only is gold’s nemesis starting to show newly found strength, the very high level of net longs suggests that the long gold trade has become frothy, and the large crowds on the long side of the trade may not be able to sustain their weight for longer – we may see a correction in gold prices soon.
The recent one-way trade in gold was encouraged to a large extent by the flip-flops of the Federal Reserve on their long-sought quest for "rate normalization." The Fed turned “dovish” since they tightened policy in December. Tumult in international financial markets stayed the hands of the central bank hawks, and that allowed Fed doves to gain the upper hand in subsequent FOMC deliberations. Thus far, the ascendancy of the "doves" led the Fed to pause in its rate "normalization" it has always wanted to do, and reduced the expected pace of rate hikes in 2016 by half. That paved the way for a weaker US Dollar and provided an opportunity for gold and other precious metals to shine. In a previous Commodity Insights Weekly report ("It is time to refocus on the US Dollar as a key driver of risk-on, risk-off”, April 12, 2016), we made some observation and forecasts, which included: (1) the US Dollar (DXY) will probably fall to the area of at least 92.00 perhaps lower, and (2) gold prices will likely test $1300 again. Both events have come to pass, and so we now look at the other side of the coin – an imminent US Dollar recovery over the next few months, and so a pullback in gold and other PMs will follow, if that USD weakness comes to pass.
But what will make the US Dollar stronger from here? Following the current train of market logic, the US Dollar will keep on weakening if the Fed will not raise rates this year. And so based on that assumption, and further assuming of course, that the US Dollar will indeed continue to weaken if the Fed fails to raise rates, we have to assess the odds of the central bank tightening policy this year and by how much. Some say that recent data stream seem to support the picture of a dovish Fed. The April nonfarm payroll data did not measure up to expectations, true, but it was not a disaster as the news makes it out to be. However, recent US economic news flow is not consistent; industrial production runs the risk of turning lower again; the durable goods report was abominable. Now, if growth data is all that matters in the Fed’s calculus, then the case for a tightening at this time is not a slam-dunk. But the reaction function of the Federal Reserve at it pertains to monetary policy tightening has changed – domestic economy is no longer the Fed’s sole consideration in policymaking. These metrics may not be the only ones to focus at if we are trying to divine what will make the central bank pull the trigger (which could arguably strengthen the US unit, and weaken the price of gold). The reality now is that US central bank has all but explicitly recognized a new mandate: promoting global financial stability (that is, the situation in China, as was the case in January, when the Fed stayed their hands).
But the financial turmoil in January this year has morphed into a more stable environment, and the erstwhile "sick man" of the world, China, is showing signs of stability and, indeed, recovery. Indeed, commodities, the accepted barometer of global economic conditions, have made a remarkable recovery since January, and Emerging Market assets have rebounded by significant amounts, and some analysts are saying the recovery has become even frothy. So in this regard, the international “mandate” of the Fed has ceased to be a burden. But lest we forget, the Fed’s dual mandate remains in force. And while the Fed’s recent rhetoric has been dovish, the fundamentals of the US economy – particularly those that should matter most for the Fed by virtue of their full-employment and price-stability dual mandate – indicate a clear case for further rate hikes. The unemployment rate is down to just 5%, job growth is strong and consistent, and jobless claims are still on a clear downward trajectory as it has been for several years. On core inflation (excluding the food and energy components), the trend suggests that the Fed is falling behind the curve. Core CPI is at a post-crisis high, having risen 2.3% year on year in February, 2.2% in March, and by our reckoning, another rise in April. Moreover, inflationary pressures will likely mount as the year progresses. With the household debt-to-asset ratio now approaching levels last seen in the 1990s, consumers have plenty of capacity to ramp up their borrowing. At the same time, the cost drag on inflation is set to diminish as the oil price stabilizes, and the dollar’s recent softness implies further inflationary pressure.
So it seems to us that domestic progress puts the Fed, with a newly-adopted international mandate, in a difficult position. The Fed is essentially trapped between a US economy that increasingly justifies normalization of monetary policy, and the interest of the still-fragile global markets – in which about 60 of the world’s transactions are dollar-denominated – in further dovishness. This concern may, in fact, be the reason why the Fed continues to stay their hands. But to assume that the central bank will in fact ignore their domestic mandate for longer, and continue to be remain solicitous of international markets and not tighten policy for the whole year, is not a very viable hypothesis to put your money on. As we see it, the Fed is being primed by the current benevolent financial markets to change the tenor of their story. If the US and global data remains on its current trajectory, the FOMC will be looking hard at the possibility of a June or a July hike. True, there is a lot of data between now and the June meeting. But if conditions remain as is during the next six weeks, with no major blow-up in the US or elsewhere in the globe, then the odds are probably higher than the market is expecting at this time. We can not be complacent about a June or a July hike - we believe any of those events is still pretty much in play.
If the Fed tightens policy sometime soon, it should strengthen the US Dollar, and that, mechanically, would weaken the price of gold and precious metals. We do not see another overpowering US Dollar performance – we start with the assumption that two rate hikes this year could allow the greenback to claw back circa 50 percent of its losses from its recent highs. That could also undercut gold prices by the same amount. However, we see a forthcoming "correction" as a "healthy" development from a price discovery point of view. The next uptake in risk asset prices including gold should make back the ground that will be yielded in any short-term correction – and gain even more thereafter.
The more significant development for gold is that any such price pullback in the short-term is a tremendous opportunity to position for a long-term (at least two years) bullish trend of the yellow metal. We believe that we have seen a cycle-phase bottom in December at $1051, and the rally in the metal since then is the initial stage of the recovery. A pullback from here, over the next two months or so, would be in technical terms a “test of the low” – and if no new lows occur during this phase (and we do not expect any), then the bullish long-term gold outlook may be in the clear. The gold market has not been paying much attention to the emerging consensus that US monetary policy has just about reached its limits in kick-starting the domestic economy. The new mantra is “fiscal expansion” and if this belief takes root, it will be a tremendous boost to gold, precious metals, and other risk assets. This is why:
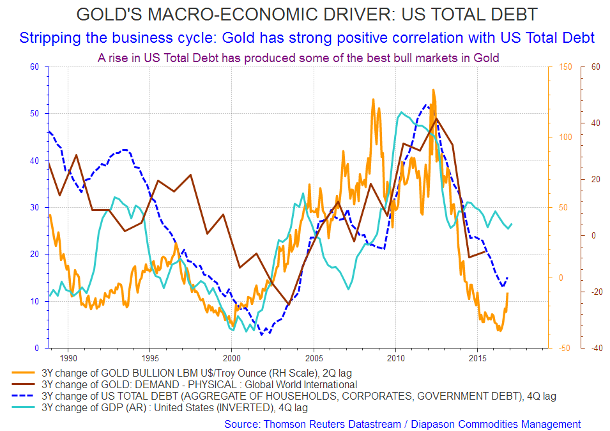
It is a well-known market lore that gold is negatively correlated with US GDP growth. The negative correlation with US GDP stems from gold's positive correlation with US aggregate debt, which in turn, has a negative relationship with US growth (see the second chart of the week below). Gold is positively correlated with Total US Debt, which on aggregate, is negatively correlated with US GDP growth. It is very easy to explain the inverse correlation between debt and US GDP - that is, debt growth rises when GDP growth slows - in other words, debt growth is a function of GDP. To keep their living standards at the same level, individuals, corporations and the government borrow when GDP slows down. For the government, it is the automatic (spending) stabilizers that keep borrowings high (thereby making debt rise) when GDP slows down which reduces tax revenues. Those automatic stabilizers are there by law, even if spending for them increases the debt over GDP ratio.
 |
Main drivers this week:
|
Commodities and Economic Highlights
Commentary by Robert Balan, Chief Market Strategist
Commodities: do not mistake volatility as the end of the commodity cycle
The recent rally in commodity prices has been a pleasant surprise to many, more so since it had supported the stock market's rebound from the January pits. It is also starting to convince previous sceptics, and the gold rush from early in the year helped improve the over-all asset internals, and is helping cement the notion that commodities, just maybe, be bottoming out. Does this notion have merit? Does the commodity rally actually make sense, in the light of the current conventional wisdom that the secular commodity cycle is dead.
To make or belie the case, we have to refer to the Commodity Research Bureau's BLS Spot index. The index arguably shows that the secular uptrend in nominal commodity prices actually remains intact. The BLS Spot Index peaked at 576.52 in April 2011; the lowest it has been since then was at 374.78 on January this year. In nominal terms, the BLS Index lost 34.99% in 5 years. So is the secular trend in commodities over? If the BLS index is the metric, the answer should be no. This may surprise many readers who probably have assumed that commodity prices have been flattened beyond recognition, a mistaken notion.
For instance, gold prices fell from $1778 in October 2012 to $1062 in January this year – a 40.26% decline. But that is minuscule compared to the run-up in gold prices from $256 in 2001 to 1778 in 2012 – a 594.53% gain in just 11 years. Another example is crude, the "star" of the news lately: spot oil fell from $124.25 in April 2012 to $29.3 in January this year – a 76.4% decline in four years. But this precipitous fall was preceded by a parabolic rise from $38.8 in January 2009 to $124.25 in 2012 – a 220% rise in three years. There are other examples, which have even better profiles: LME spot copper fell from 9650 in 2011 to 4705 in January this year. It fell 51.25%, which is not a disaster, considering that copper rose from 3199 in January 2009 to 9650 in January 2011, a 201.65% increase. What does this prove? It proves that commodity prices are volatile, but it cannot be the basis for saying that the secular commodity cycle is dead.
It should be clear that in spite of the huge volatility of the commodity index, the trend of commodity price still hew to an uptrend, as it rightfully should. The reason is clear: nominal commodity prices are not only a function of the supply-demand fundamentals of commodities themselves; they also reflect the fundamentals of the money supply of the currency they are priced in. As a concrete example, M2 money supply in the US increased from a 1679 index 11157 index today. Given that the supply of dollars in the US economy (M2) has increased by approximately 564% since 1959, we should expect that most nominal commodity prices should never again decline to the lows of 1998-2002 (to cover the various troughs of commodities during that period).
If we are to shift the focus from the US Dollar and US money supply to China, the undisputed king of commodity consumption, there could be reasons for commodity producers to sit up and take notice. The Chinese government, in Q4 2015, decided during the year-end plenum, to defer the ongoing transformation of the country's economic model and significantly expand their fiscal expenditures over the next five years. Basically, they fell back into the tried and true model of infrastructure and capital spending, which will be powered by another massive credit expansion. As a result of the shift in strategy, China's narrow money supply M1 has exploded from a low of 1.17% in January of 2014 to a recent 22.05%, yoy. The money growth acceleration took place between September 2015 and March 2016, as bank lending in China suddenly went on steroids. It is still ongoing.
China's reflation drive has been explosive. Evans-Pritchard at UK's The Telegraph documents the changes: new home sales jumped 64% in March from a year earlier; house prices have risen 28% in Beijing, 30% in Shanghai, and 63% in the commercial hub of Shenzhen; the rush to buy has spread to the Tier 2 cities such as Hefei, which saw gains up 9% in a single month. What this does underline is that the volatility of commodities should be accepted for what they are – it is a boom and bust, feast or famine business, under certain conditions. That in itself is not bad; in fact if the commodity investor understands the basic underlying issues that make the asset classes do what they do, there is room for opportunities for everyone.
It looks like the Crude Oil rally will soon stall
The overarching reason for the decline oil since November 2014 has been the confluence of massive supply, first from the ill-disciplined shale frackers, and second, from the determined effort of the OPEC (KSA) to bring them to heel, and eventually decapitate them. The world had been, and still is, awash in oil. Oil inventories are still rising-- crude inventories in commercial tanks in the U.S. came out to 543.4 million barrels last week. When compared to the 540.6 million barrels seen just a week earlier, this implies a 2.8 million barrel build took place. Nonetheless, if the seasonality pattern asserts, we could see a peak in May. Imports have been higher in the second quarter than in the previous two quarters. There were missed opportunities for the major producers to check the rising output, but it seems now in retrospect, that the Saudi went into the April 17 meeting in Doha with no intention of freezing production. Saudi Arabia has consistently said that it desires to pump as much oil as the markets want or can bear.
And now, KSA has a new oil supremo that is making no bones about keeping production flat out, presumably to deliver the coup de grace to the US frackers and assorted high-cost producers. Iran is in the process of quickly ramping up their production. All other cartel member nations are following suit. What is in that set that is favorable to further rise in crude oil prices? And now, there is the added wrinkle that the US Dollar may have just seen a significant bottom last week. Short of an earth-moving development, like a major oil-producing field imploding, a rising US Dollar will surely hammer oil prices.
On the other hand, US production is plummeting. The EIA said that domestic output for the week came out to 8.825 million barrels per day, a decline of 113 thousand barrels per day (or 791 thousand for the week) from the prior week's output of 8.938 million. This, so far, is the largest weekly decline seen in quite some time, and is understandably being trumpeted as a harbinger of further decline, if not collapse, of US oil production. Moreover, serving as counter to the copious output, demand has shown strong indicators. The EIA says that motor gasoline demand during the week averaged 9.502 million barrels per day, up 2% from the prior week's 9.315 million per day and 8.2% above last year's number of 8.785 million barrels per day. A four-week average yields 9.474 million barrels per day, an increase of 5.8% over last year's 8.951 million barrels per day. Distillate fuel is going well. Over the past four weeks, demand has averaged 4.049 million barrels per day, an increase of 4.2% compared to the 3.884 million barrels per day estimated for the same period a year earlier.
Will supply trump demand? The answer is not that difficult to arrive at. The US and the rest of non-OPEC output is indeed declining, but its positive impact is being cancelled by the corresponding increase in OPEC supplies. That was the game plan of OPEC all along, and it is succeeding brilliantly. While demand is indeed good and is even getting better, the determined effort of the Saudis and OPEC to grab market share and kill-off the high producers in the process by producing more oil is trumping every else that is coming from the consumption side. And this is not a quickie strategy either. The frackers are proving to be more resilient by improving productivity, and by judicious hedging as oil prices were ramping up in the past weeks. Although many banks abandoned the previous strategy of giving all the money the frackers can drop in a drill hole, there is enough capex and opex to keep some of the bigger outfits to maintain production. But it is a one-sided fight, like a match between heavyweight and flyweight boxers. The flyweight is more nimble and feisty than expected, but the outcome is in no doubt -- it is just a matter of time before the bigger guy flattens the smaller guy.
And now, there is a strengthening US Dollar that the oil market has to contend with. It does not take much USD rise to undercut oil and commodity prices. The US Dollar has previously weakened on the mistaken notion that the Fed will not be able to raise rates this year. But unfortunately, as our main CIW story this week shows, that narrative is a gross mistake – the Fed will likely raise rates at least twice this year. That will undercut the premise that had underpinned the rally which oil and other commodities (think gold) have enjoyed in recent weeks. And so oil prices have to come down soon.
According to the EIA, crude inventories in commercial tanks in the U.S. came out to 543.4 million barrels last week. When compared to the 540.6 million barrels seen just a week earlier, this implies a 2.8 million barrel build took place. In the past, there've been many instances where builds have been far larger than this but any sort of increase in supplies at this point in time, especially when the API (American Petroleum Institute) had forecasted a build of 1.3 million barrels and analysts had expected stocks to grow by 1.7 million barrels, is a negative for the market and investors in this space.
With the next meeting of OPEC scheduled for early June, the chances of any agreement or changes in production policy are less than likely. Russia, the world's second-largest producer of crude oil on a daily basis, will continue to produce at ever-increasing levels. The low price of oil is forcing the Russians to sell as much as possible for cash flow purposes.
Charts of the week: Gold net non-commercial positions; Gold’s macroeconomic driver: US total debt
|
|
|
|